Understanding what your small business is worth using a few essential valuation ratios, my in-depth small online business report, plus a handy infographic.
What’s your business worth?
We all think about this periodically, even if we are happily running our companies and have no intention of selling today. How else are we going to be able to sit around fancy tables cracking escargot jokes tomorrow?
Financial buyers value private companies using a few common ratios, specifically price/revenue (P/R) and price/earnings (P/E). But these ratios vary according to all sorts of variables from the size of the company in question to how fast it is growing to its industry and business model.
Even for the identical companies, the ratios may vary over time depending on prevailing macroeconomic conditions.

To make an educated decision about whether to buy or sell a company, we need to know these ratios. If we aim to sell, we want to sell when our relevant ratios are peaking — we’ll get more for our business. And if we aim to buy, we want to find companies priced below their comparable companies (a deal), or we want to identify a time when all companies have depressed valuations (lots of deals).
In this article I present some data that could help you as a buyer or seller, giving you a more accurate picture of small online business (“SOB”) valuations. To download the report now, click here. And — not to ruin the punchline — if you run an ecommerce company, now might be the time to sell…
Infographic
My Goal: Find the Ratios

My goal was to get a good read on small online business private M&A activity . . . to create an ongoing “SOB Report”.
I don’t care about public M&A activity — if Amazon buys Zappos, that is irrelevant to the kinds of businesses I’ve run and would be interested in acquiring. I don’t even care about larger private activity: billion dollar private equity funds that lay down hundreds of millions on companies valued in the hundreds of millions is just as unimportant to me (unfortunately).
What I do care about is activity in the “micro” space: deals from a few hundred thousand dollars up to, say, five million. Deals north of Flippa, south of the private equity shops. And I only care about online businesses — Inc. and other publications have great reports on brick-and-mortar business valuations, but little about online pure-plays.

That’s the space I operate in, the space with imperfect information that I think creates big opportunities for buyers and sellers alike.
Within this space, I wanted to get an approximation of the current P/R and P/E ratios. These would let me know when I’ve found a deal on a potential acquisition. And yes, at this point in my career, I’m buying, but the information is just as relevant to you if you are considering selling.
My Methodology

This is an interesting hypothetical though. What is the funniest ‘trading places’ for SAAS and Ecommerce? A Rob Walling for an Andrew Youderian? Doesn’t make me chuckle, too similar. Maybe a Jason-trade: Cohen for Goldberg? Now we are getting somewhere. Cohen is so hard-core bootstrapped software it would be fun to see him at the helm of a VC-backed fashion rocketship. I think my final vote would go for any trade involving Patrick McKenzie — McKenzie for Dunn, McKenzie for Wilson, McKenzie for Firestone. With a Patrick trade, you’d have the extra comedic dimension of watching one of these American ecommerce CEOs adapt to life in Japan. Not quite the gorilla scene, but it has potential in a Beverly Hills Ninja kinda way.
To collect data on this space, I had to make some assumptions. Obviously there isn’t much data out there — brokers rarely, if ever, publish sales data after completing a deal.
But they do publish data before a deal in the form of new listings on their sites and in their email newsletters. The listing data typically includes some qualitative information about a company along with three numbers: revenue, cash flow, and asking price.
Not the exact numbers I need, but I used them as proxies. Here’s why I thought that made sense:
Cash Flow as Earnings
I used cash flow as a proxy for earnings.
I could and probably will write an entire post about how hard it is to break earnings out of cash flow to get a proper P/E ratio for a small business. Suffice it to say that an accurate cash flow number is a moving target. Owners want to convey a high cash flow so they get a higher valuation. They will often argue that they spend “no time” on the business and that all the money they take out is essentially cash flow, free and clear.
But think about it. To replace the owner, you will have to hire someone to do some work, or do it yourself. You should deduct this replacement cost from cash flow as it is an operating cost of the business.
For the purposes of this analysis, though, I just took the brokers’ word for it. This was much easier in aggregate than doing diligence on hundreds of deals to try to get an accurate earnings number. I could use an intern for that.
Ask Price as Sale Price
Similarly I used the ask price as a proxy for the sale price.
We all know that the ask price rarely, if ever, equals the sale price. But two assumptions make the ask price data useful:
-
The average deal price is probably a standard fraction of the average ask price. Assuming most buyers can negotiate the seller down a bit on the ask, then (Deal Price) = k*(Ask Price) where k<1. Back in the day the AOL Corp Dev team would roll in and say ‘OK we will give you 2x your ask but that’s our final offer’. Alas.
-
This fraction, k, stays roughly constant over time. In other words, the trend in the ask price will mimic the trend in the actual deal price over time.
Keep in mind that relative ratios are just as useful as — if not more useful than — absolute ratios. I don’t care so much about the exact ratio as I do about how it changes over time (i.e., is now a good time to sell or buy?) or whether a specific target company is priced above or below the average ratio (i.e., have I found a good deal?).
Therefore my two assumptions allow us to use ask price as a proxy for sale price. Sound fair enough? I think so.
There we have it. After electing to press ahead with the publicly available numbers, all I had to do was scrape the data. Once that was complete I classified the listings according to company type (ecommerce, leadgen, SAAS, etc.) and calculated our few target M&A ratios like ask price/cash flow (A/CF) and ask price/revenue (A/R). Finally, I built a few pivot tables to compare these ratios across the company types and sizes.
Easier than selling pork bellies.
Insights
It ain’t perfect, and it’s by no means comprehensive, but my limited data set does allow us to make some observations.
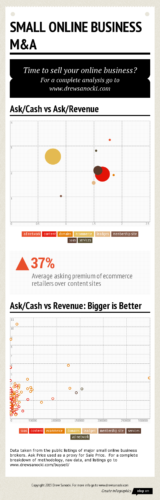
Ratios Across Business Type: Retailers Beat Adsense Sites
Here is a scatter plot of the key ratios I mentioned above — the size of each circle represents the number of deals over the past few months.

As you can see, there are many more ecommerce and content sites for sale than other business types (big circles). Our A/R ratios are much lower for ecommerce than for anything else . . . this is because margins in retail businesses tend to be smaller than those in the other business.
The A/CF ratios are more telling: what would a buyer have to pay to buy a dollar of cash flow? Surprisingly, ecommerce cash flow is more expensive (~$2.60) than content, leadgen, and SAAS cash flow (~$1.90).
This is weird, right? Those others are supposed to fetch higher valuations because they are much easier to run, infinitely scalable, and run by taller, more attractive people — so what gives?
To find the answer I pinged a couple of brokers, and here’s their theory: content businesses are now (fall of 2013) literally terrifying buyers. Google has had two major algorithm changes — and several smaller ones — in the last few years that absolutely crushed a large number of content sites. Can anyone say ‘hot potato’? Buyers understandably view these properties as much riskier than an ecommerce site cranking along selling products.
The added risk depresses the valuations. So if you were a value-based investor, you might consider buying up a portfolio of them hoping that they one day return to favor.
Why is SAAS so low? Unclear. Maybe buyers feel they need some software chops to run them, which are harder to come by than ecommerce chops. Maybe my data set is too small, and I need to find some more SAAS brokers. (Intern!) Either way, I’m not sure we can conclude anything from the lower SAAS ratio without some more data.
Price Ratios and Size: Bigger is Better
Here’s another chart I found interesting:
The chart displays absolute dollars of cash flow on the x-axis, and the A/CF ratio on the y-axis. Although it could use more data points for businesses north of a half-million dollars in cash flow (Mental note to find some more brokers here — I say again, “Intern!”), the data suggest two things:
- The A/CF ratio gets higher the larger your cash flow (plot goes up and to the right), and
- the ratio is all over the place at very low levels of cash flow.
Both make sense. Valuations get higher with more cash flow because the company is more robust and less risky. To take it to an extreme, most investors would pay more for a dollar of Coke’s earnings than they would for a dollar of WidgetDirectUSA.com’s earnings: Coke’s are more predictable, more certain, and more defensible whereas WidgetDirectUSA lives in a state of constant paranoia that Amazon will roll out Widgets.Amazon.com.
But why do things get crazy at lower cash levels? I think that’s the ‘Mom-and-Pop’ Owner Effect. At these levels, you’ve got Deluded Owner Guy jacking up his ask and Burned Out Owner Guy ready to ditch his business for a song. Chaos ensues, and the asking valuations are all over the place. Although it is harder to achieve any scale with these small deals, opportunities abound here for both buyers and sellers. Buyers try to find their underpriced diamond and scale it; sellers try to find someone to hit a crazy high multiple.
Next Steps: Let’s Take It to the Next Level

I could spend all day cutting up this data, but at this point you might want to download it and take a look for yourself. All of my SOB Report data and calculations are available in a single Google spreadsheet, which you can download by clicking here.
The spreadsheet contains all the listing data complete with the following:
- links to the broker’s actual listing pages so you can see the good and bad deals,
- information on which businesses have been sold and which are still available,
- a few more charts and pivot tables comparing the ratios to things like revenue.
Want more? Going forward I plan to add to this data set and series on my site. Specifically, I’d like to do the following:
- Add brokers and listing data. The more the better, the less chaos.
- Examine the ratios over time. The September 2013 snapshot I’ve started with here is helpful (who knew about the Google algo effects?), but examining how these ratios change over time will help us better determine when is a good time to consider buying or selling a business.
- Break out different kinds of ecommerce companies. I’d like to break out the pure-play drop-shippers from those who hold inventory from those who sell information products. I suspect we will see different ratios for each.
If you have any other suggestions on what you’d like to see, please post them in the comments below.