ROAS is bullshit. You should use ROMI instead. Here’s what it is and how to calculate it, along with a spreadsheet to make it easy.
Speaker after speaker took the stage.
Inevitably, in the middle their talks about this killer Facebook ad hack or that funnel that netted $8 million in 8 weeks, they trumpeted their ROAS—Return on Ad Spend.
“This campaign got us a 10X ROAS!”
or
“Believe it or not, we hit a 50X Row-Az in month one!”

If I hear one more guru spout off about his “10X ROAS on a Facebook campaign,” expecting me to duplicate that performance, I’m going to lose it.
ROAS is a bullshit metric.
It tells us very little about how productive our marketing is.
In my last post, I laid out the importance of productive marketing—marketing for which you can measure the impact on sales for every dollar you spend.
(Missed it? Go read it. In it, I explain how you scale profitably.)
After reading about marketing productivity, you are probably asking: OK, I get the concept, but how do I measure that impact anyway? It’s not as easy as dialing it up in Google Analytics after all.
In this post, I’ll lay out two solutions. One is BS, the other isn’t.
Method #1: ROAS
ROAS stands for Return on Ad Spend. And judging by how often it’s tossed about, it’s the default “return metric” in the industry.
It’s a simple calculation—probably why it is so popular:
ROAS = Revenue / Spend
If you know how much you spent on a marketing campaign and how much revenue you generated, you can gut out a ROAS calculation.
Here’s a quick example: I look at my Facebook admin and see that last month I spent $30K on ads. Facebook tells me that that spend resulted in $90K in revenue. This means that my ROAS is 3:
$90/$30 = 3, or 3X
I generated three times more in revenue than I spent in advertising. Great, right? High-fives, chest bumps, and all that good stuff?
Not so fast, kemosabee. Some problems with this logic exist . . .

Issue #1: ROAS ignores attribution
The first issue is attribution. As most of you who have been living online for more than a month know, transactions are not as simple as Visitor Sees Ad, Clicks Through, and Buys Product.
This direct response does happen, but more often than not it’s Visitor Sees Ad, Clicks Through, Consumes Content, Leaves, Clicks an Adwords Ad Later, Thinks About It, Takes Dog Out, Goes Directly To Site in A Couple Days, Signs Up for Email List, Weeks Pass, Clicks on Email Promotion, and Buys Product.
We can get around this measurement nightmare by arbitrarily assigning every purchase to the Last Touch marketing campaign (sort of what GA does out of the box).
Or the First Touch campaign.
Or All Of Um.
However we attribute that transaction probably matters less than that we just do it at all. Without using a default attribution, though, any ROAS calculation is tenuous at best. And comparing ROAS—and marketing productivity—across channels or ads doesn’t actually tell us a whole lot.
Issue #2: You can’t use ROAS across many types of marketing campaigns
You know those on-site promotions we all run? Do any of these sound familiar:
- Popups featuring a deal for first-time buyers,
- Abandoned cart emails with promotions to complete checkout,
- Win-back campaigns that create an incentive to come back and buy,
- Cross-sell promotions (“buy two and save!”),
- Free gifts with purchase, expedited shipping, events, newsletters,
- and almost anything that lacks a clear ad cost?
If you want to see how any of those are performing with you, ROAS won’t help. What’s in the denominator after all? Unclear, right?
How can you tell whether a 10% off opt-in offer or a sweepstake is better for you? What’s your metric? (Don’t say “conversion rates.” You can convert your way to bankruptcy if your campaigns are not profitable. Exhibit A: Karmaloop.)

If you have been online for any period of time, you probably have heaps of untapped profits in these kinds of “non-ad” campaigns. Your job is to unlock them. We need a metric that will help us assess how productive all our marketing is, not just our ad campaigns.
Issue #3: ROAS isn’t a return metric
The second issue with ROAS is that it’s not a return metric!
A “return” on an investment means profits or cash generated. It doesn’t mean revenue generated.
If we are doing productive marketing, we are after profits. We need to know the investment return on our spend.
Revenue doesn’t pay the bills; profits do.
Take our example. What if that $90K of revenue had a cost of goods (COGS) of $50K, a customer service cost of $10K, and a shipping cost of $10K? Together with the $30K I spent on ads, that’s a total of $100K in expenses . . . so I lost $10K on the campaign:
$50K + $10K + $10K + $30K = $100K in expenses
and
$90K – $100K = -$10K
This is why no high-fives. My “killer 3X ROAS!” just lost me $10K.
That’s a financial ROI of negative 30% last month. Annualize a monthly 30% loss and you go broke very quickly.
When is ROAS not bullshit?
When you are looking at your own campaigns . . .
When those campaigns are not on-site promotions . . .
When you know that you are selling roughly the same products across campaigns…
When you run the same promotion across all those campaigns…
When you know the return rate is the same across all those campaigns…
When you know your own profit margins and what ROAS you need to break even.
That’s a lot of whens. This is why the ROAS Gurus kill me.
Heck, I could get you the world’s best ROAS next week. All I would do is empty a boatload of 50% off coupons to your Facebook account—share them with a friend and you both get 50% off!
Revenue would skyrocket, ROAS would look great, and you’d want to punch me in the face.
ROAS is BS. We can do better.

Method #2: ROMI
To measure marketing productivity, we need an investment metric. ROI—Return on Investment—is the answer.
When you invest in a stock or bond, you want to know your total return—how much you made (profit) or lost (loss) relative to the amount of capital you laid out.
That’s your ROI.
Taking a lead from my mentor Jim Novo, let’s call it ROMI for Return on Marketing Investment because we are talking about marketing spend here.
ROMI tells you how much cash flow you generate for every dollar you spend on marketing. It’s the ultimate measure of marketing productivity.
Here’s how you calculate ROMI…
Here’s the formula:
A) ROMI = Amount You Made / Amount You Paid to get it
Don’t get hung up on terminology . . . gross margin vs. net profits vs. gross profits vs. discount amounts yada yada yada. At the end of the day, think of the big picture:
The Amount You Made is what you pocket. You take your revenue and net out all the costs that went into it, including product costs, variable costs (costs to pick, pack, ship, and service an order), and marketing costs (discounts, ad costs, etc.). So:
B) Amount You Made, or Net Profit = Sales (after discounts and returns) – Variable Operating Costs (pick, pack, ship, service, whatever) – Marketing Expenses (usually ads and mailings)
And, big picture, the Amount You Paid is what you spent. It should include everything you paid to run your marketing campaigns that generated that revenue (ads, copywriters, whatever) plus any discounts. So:
C) Amount You Paid, or Marketing Spend = Marketing Expenses (ads, copywriting, etc.) + Discounts
Discounts are the only “gotcha” of the calculation. Most marketers blow off discounts. Why, I don’t know, but you technically “spent” that discount amount as part of the promotion to acquire that customer, so you should include it in your marketing spend.
One of the better things you can do is to measure the impact of your promotional (discount) activity. This is how you do that.
A cheesy ROMI example
Kinda makes your heads spin, so let’s walk through an example.
I was up in the Dolomites last month, and my feed bag contained a ton of alpine cheese.
https://www.instagram.com/p/BW5Uku1FQg2/
Say my buddy Jurgen runs AlpineCheese.com. His site has one product: a $20 pack of cheese. Cost of goods on that is 50%, and it takes Jurgen $5/order to pick, pack, service, and ship the queso.
(See how I’m already incorporating more into this calculation than ROAS?)
Jurgen runs a Facebook ad campaign. His ads feature “15% off your next purchase” with a coupon code.
(Oooh a discount code! ROAS doesn’t include those either!)
After a month he’s spent $200 on the campaign. It drove 200 orders. On average, hungry dudes ordered 2 packs per order.
Here’s how Jurgen calculates his ROMI. He starts by working backwards with the equations above. First, we need the Amount He Made (equation B):
B) 200 orders x 2 packs per order x $20 retail price = $8,000 revenue at full margin
15% discount x $8,000 revenue at full margin = $1,200 in discounts, so total sales are $6,800
$6,800 is the revenue number Jurgen would see in Google Analytics. Jurgen has to pay for the cheese too:
$8000 x 50% COGS = $4,000 COGS
Gross margin is now down to $2,800. It also costs him something to fulfill and service the orders:
200 orders x $5/order to fulfill and service = $1,000 variable overhead cost
Net profit before marketing expense is now down to $1,800. And finally, let’s include that Facebook marketing expense:
$200 in ads = $200 in marketing expenses
So we arrive at a final net profit $1,600. To summarize:
Amount Jurgen Made = $6,800 sales – $4,000 COGS – $1,000 variable operating costs – $200 marketing expenses = $1,600 net profit
We’re half way there! To calculate the Amount Jurgen Paid, we add up all the marketing expenses and discounts (equation C):
C) Amount Jurgen Paid = $1,200 in discounts + $200 in ads = $1,400 marketing spend
The ROMI calculation now becomes net profit over total spend (equation A):
A) $1,600 net profit / $1,400 marketing spend = 114% ROMI
Holy fondue, Jurgen generated a 114% return last month! That’s $1.14 in profits for every $1 he spent.
In other words, he spent $1, then got back that $1, and then he pocketed an additional $1.14.
That’s really telling us something! The dude is jumping around in his lederhosen!
Do you see how ROAS is useless here? Jurgen’s ROAS last month was:
($6800 in sales)/($200 ad spend) = 34X
ROAS Gurus would be going nuts over a 34X ROAS, but that number doesn’t tell us a whole lot.
For one, it exaggerates the return. It does not capture the fact that Jurgen gave away margin in the form of a promotional discount.
Most of you readers are giving away discounts left and right. That’s margin you should be tracking.
And for another, Jurgen would not be able to compare the ROAS number across ad campaigns or promotions. If Jurgen ran another follow-on promotion next month offering only 5% off, comparing the ROASes of the two promotions won’t tell him which promotion was better for his bottom line.
Some caveats on ROMI
There are some caveats to consider when you use ROMI.
- Attribution is still an issue with ROMI. Jurgen has to link transactions with marketing spend. As was the case with ROAS, he can do this by choosing and sticking to an attribution model. BTW here’s where discounts—more precisely, unique coupon codes—actually simplify things: you can count the number redeemed and know which campaign the customer got them from.
- You can annualize ROMI. The 114% is a true return over one month. If we wanted to be dicks, we would insist that Jurgen annualize it, so his annualized ROMI is more like ~1300%.
- ROMIs get better over time. Jurgen’s ROMI is probably even higher than 1300%. Promotions bring defecting customers back into the fold. Some will rebuy again later on at full margin. This is the crux of a good customer retention program and tripwire marketing.
- It’s easier to raise capital off of ROMI. Jurgen’s 1300% is a true return. Compare that with the stock market, where annual returns are more like 7-10% annually. OK Ms. Private Equity Investor, where would you rather put your fund’s cash right now? Into the market? Or into AlpineCheese.com? Jurgen is not going to convince you to invest off of an ROAS . . . but his ROMI will attract you like cheese attracts a mouse.
This is what productive marketing is all about. It’s about allocating your resources across your portfolio to maximize your profits. When Campaign A is generating a 114% ROMI and Campaign B is generating a 20% ROMI, you shift all your time, effort, and funds from Campaign B to A.
Try doing that with ROAS. You can’t.
How to make this stupid easy
If you’ve followed along this far, you might be thinking I get it, but calculating this is a pain in the ass.
I hear you. To make it easy, below is a link to a spreadsheet template to help you calculate ROAS and ROMI:
I broke the spreadsheet into separate marketing channels so that you can compare ROAS and ROMI across each.
Be sure to check out the default examples in there. In particular, you can see how Ad Campaign #1 results in a higher ROAS than Ad Campaign #2, but Ad Campaign #2 generates the higher ROMI. This shows how ROAS can be misleading. If this were my company, I’d want to shut down the former campaign and back the latter.
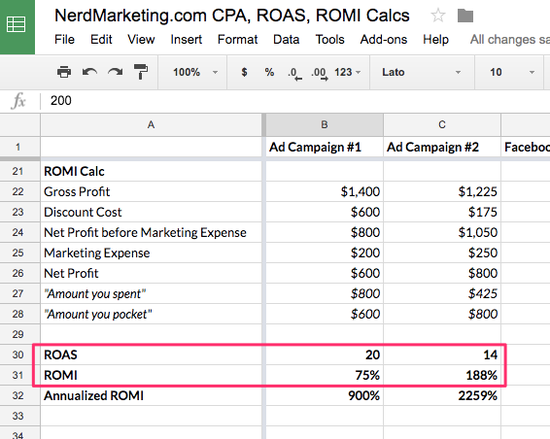
Blindly following ROAS can lead to lower profits. Want to be your own ROMI Guru? Just download my spreadsheet and go to work.
Go ahead and copy the sheet, carve yourself a hunk of alpine cheese, put on your David Swenson hat, and fill in the data. I recommend doing this at least monthly to stay abreast of what’s working at your business. I’ve embraced this approach at every business I’ve been involved with, from SAAS to ecommerce.
Wrap up
In this post I wanted to show you some issues with ROAS as a measure of marketing productivity. I wanted to introduce a better alternative: ROMI.
I also wanted to mention cheese and lederhosen.
ROMI will tell you the profit generated for each dollar spent. You should use it to compare campaigns and reallocate your focus and budget to your high-performers.
To crank on this each month, use my template.
Everybody say cheese.